|
| Trigonometry |
|
|
|
|
|
Graphs of
Trigonometric Functions |
| The Graph of the
Sine Function f
(x) = sin
x |
 Properties of the sine
function
 |
|
Domain and range |
|
Zeros of the function |
|
Extremes, maximum and
minimum of the sine function |
|
Parity and periodicity
of the sine function |
 Behavior of the sine function
 |
|
|
|
|
|
|
|
|
Graphs of
trigonometric functions |
|
Visual presentation of changes and behavior of each trigonometric function shows us its graph in the
coordinate plane
xOy.
|
| A graph of a function is formed by points
P(x, f (x)), where the abscissas
x
belong to the domain and the calculated values of the function f
(x)
as the ordinates, which are the corresponding values from the range.
|
|
| The graph of the
sine function f
(x) = sin
x |
| The unit circle is divided to arbitrary number of equal parts, for example
12
as on the below figure, which then measure
2p/12
= p/6
each.
|
| On the same way starting from the origin divided is its circumference
2p
to the same number of equal parts on the
x-axis.
|
| That way, an arc
x
becomes the abscissa of a point in a coordinate system. By associating the ordinates of the ending points of
the arcs x of the unit circle to the corresponding abscissas
x obtained are the points
P(x,
sin x) of the curve named sine curve or
sinusoid.
|
 |
|
| Properties of the sine
function |
| - Domain and range |
|
From the graph in the down figure we see that the sine function is defined for all real numbers
x
that is, the domain
of the function
Df = R.
|
| The graph of the sine function is bounded between lines
y = -1 and
y = 1. Therefore, the function takes all values from the closed interval
[-1,
1], written range
( f )
or f (D) =
[-1,
1].
|
 |
|
| - Zeros of the function |
|
The points of intersection of a function with the
x-axis we obtain by solving equation
f (x) = 0, |
| sin
x = 0, where x =
kp,
k Î
Z |
| that is,
the x-intercepts are,
x = 0, ± p, ±
2p, ±
3p,
¼
as shows the above diagram.
|
|
| - Extremes, maximum and
minimum of the sine function |
| The sine function reaches its maximum value
1
at the points whose abscissas are the solutions of the
|
| equation, |
 |
|
|
| and its minimal value
-1 at the points whose abscissas satisfy the equation
|
 |
|
| - Parity and periodicity
of the sine function |
| Parity - A function that change sign but not absolute value when the sign of the independent variable is changed is
odd function, that is if
|
| f
(-x)
= -
f (x). |
| Such a function is symmetrical about the origin, as
shows the figure above. |
| Let examine parity of the sine function
f (x)
=
sin x, |
| f
(-x)
=
sin (-x)
= -
sin x
= -
f (x) therefore,
the sine is odd function.
|
|
| The
sine function is periodic |
| A function
f (x)
that repeats its value for all integral multiples of a constant number
p
added to the independent variable, is called
periodic function with period p. That is, if |
| f
(x)
= f (x + n · p),
n
= 1, 2, 3, . . . |
| For the sine function holds the identity |
|
sin (x + k · 2p)
= sin x, k
Î
Z |
| that
means that all positive and negative multiples of 2p
are periods of the sine function but the least (principal) period
P = 2p. |
|
| Behavior of the sine function |
| We analyze behavior of a function by moving from left to right, i.e., in the direction of the positive
x-axis
examining the following
characteristics, |
| - intervals where the function is increasing or decreasing, |
| - maximums and minimums, and |
| - roots or zero function values. |
| Since trigonometric functions are periodic, it is enough to examine its behavior inside of one period. |
| Therefore, for the sine function we examine the interval
0 < x
< 2p. |
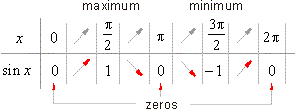
| The
graph of the sine function shows, |
|
- when the arc x
increases from 0
to p/2
the function
sin x increases from 0
to 1, |
|
- when the arc x increases from
p/2
to p the function
sin x decreases from 1
to 0, |
|
- when the arc x increases from
p
to 3p/2 the function
sin x decreases from 0 to
-1, |
|
- when the arc x increases from
3p/2
to 2p
the function
sin x increases from -1
to 0. |
| Behavior of a function can also be shown in the tabular form, |
 |
|
|
|
|
|
|
|
|
|
|
|
|
|
|
|
| Pre-calculus contents
G |
|
|
 |
|
| Copyright
© 2004 - 2020, Nabla Ltd. All rights reserved. |