|
|
|
 Stationary
points and/or critical points
 |
|
Turning points (extremes, local or relative
maximums
or minimums) |
|
Inflection points and intervals of concavity |
|
Symmetry
of a function, parity - odd and even functions
|
|
|
|
|
|
|
|
|
| Stationary
points and/or critical points |
| The
gradient of a curve at a point on its graph, expressed as
the slope of the tangent line at that point, represents the rate of
change of the value of the function and is called derivative of
the function at the point, written dy/dx
or f
'(x). |
| At
points of the graph where function changes from increase to
decrease, the slope
of the tangent line changes from
positive to negative values respectively, passing through zero value. |
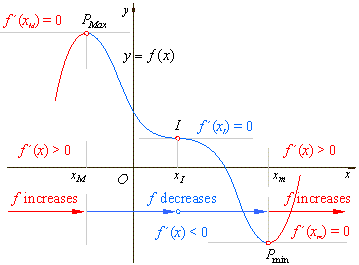 |
| The
points of the graph of a function at which the tangent lines are
parallel to the x-axis,
and therefore the derivative at these points is zero, are called
the stationary
points. |
| There
are three different types of stationary points: maximum points,
minimum points and points of horizontal inflection. On the above graph
the stationary points are
denoted as,
PMax, I
and Pmin. |
| The
graph reaches a local (or relative)
maximum
when gradient changes from positive through
zero to negative. |
| The
graph reaches a local (or relative)
minimum when gradient changes from
negative through
zero to positive. |
| A
local maximum
is a value of the function greater than any adjacent value,
i.e., in its immediate area it is the
highest point,
but it may not be the greatest value of the function over its
whole range. |
|
| The
endpoints of intervals of monotonicity are places where
function stops increasing and starts decreasing or vice versa. |
| A
function ƒ(x)
can change from increasing to decreasing (or vice
versa) at values where f
'(x)
= 0 or f
'(x)
is undefined. |
| Note that these are only potential places where the graph can change from increasing to decreasing (or vice versa) since it is possible that the function may not change at those values, as for example at the point
xI (where
f
'(x)
= 0), in the above figure or, as in case of the rational
functions from the above two examples, at the vertical asymptotes (where
f
'(x)
is undefined). |
| If
ƒ(x)
is
defined at x
= c and either f
'(c)
= 0
or
f
'(c)
is not defined, then x
= c
is called a critical
value of the function ƒ(x),
and its point (c,
ƒ(c))
is called a critical point. |
| Therefore,
a critical point may be a local maximum, a
local minimum, or neither. |
| The
critical point is neither a maximum nor a minimum if the
function does not change from increasing to decreasing (or vice
versa) at the critical point, as at the point xI
in the above figure. |
| For
a given function ƒ and point
(c,
ƒ(c)), the
derivative of ƒ at
x
= c is the slope of the tangent line through the point
(c,
ƒ(c)),
i.e., f
'(c)
= tan
at
. |
|
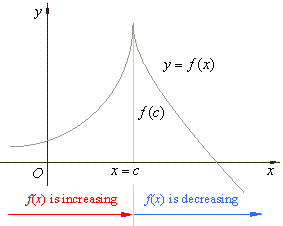
| The
function value ƒ
(c)
in
the right figure is defined and the derivative
at x
= c
is undefined, therefore the point (c,
ƒ (c))
is a critical point. |
|
| As
ƒ
(x)
is increasing before x
= c
and decreasing after x
= c,
the point (c,
ƒ(c))
is a local maximum. |
|
 |
|
|
| Turning points (extremes, local or relative maximums
or minimums)
|
| A
stationary
point at which the gradient (or the derivative) of a function
changes sign, so that its graph does not cross a tangent line
parallel to x-axis,
is called the tuning
point. |
| Thus,
a turning point is
a critical point where the function turns from being increasing
to being decreasing (or vice versa),
i.e., where its derivative
changes
sign. |
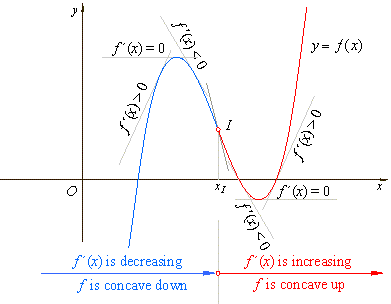 |
| A
local (or relative) maximum
is a point where the function turns from being increasing to
being decreasing, i.e., where its derivative changes sign from
positive to negative. |
| Notice
that, as we travel through
the maximum turning point from left to right, the
derivative (the slope of the tangent to the curve) is
decreasing, i.e.,
f
'(x) changes
from positive through zero to negative as x
increases. |
| Thus,
if the derivative of a function is decreasing over an interval,
the graph of the function is concave down. |
| A
local (or relative) minimum
is a point where the function turns from being decreasing to
being increasing, i.e., where its derivative changes sign from
negative to positive. |
| Thus,
as we travel through the minimum turning point from left to
right, the derivative
is increasing, i.e.,
f
'(x) changes
from negative through zero to positive as x
increases. |
| Therefore,
if the derivative of a function is increasing over an interval,
the graph of the function is concave up. |
|
| Inflection points and intervals of concavity |
| A
point on a curve at which it crosses its tangent, and concavity
changes from up to down or vice versa, is called the point of
inflection, as shows the above figure. |
| The
graph is concave up on an open interval where the slope
increases and concave down on an open interval where the slope
decreases. |
| Therefore,
the
points on a curve that join arcs of opposite concavity are
points of inflection. |
| If
the gradient of the function does not change sign at the
stationary point, then it is a point of horizontal inflection. |
|
| Symmetry
of a function, parity - odd and even functions
|
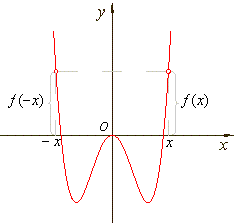
| A
function ƒ
that changes neither sign nor absolute value when the sign of
the independent variable is changed is even,
so that, ƒ
(x)
= ƒ (-x). |
| Therefore,
the
graph of such a function is symmetrical with respect to the y-axis,
as is the graph shown in the left figure below. |
 |
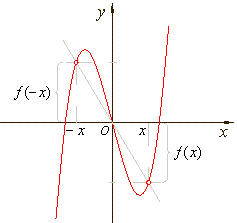 |
| The
graph of an even function. |
The
graph of an odd function. |
|
| A
function ƒ
that changes sign but not absolute value when the sign of the
independent variable is changed is odd,
so that,
ƒ (x)
=
-
ƒ (- x).
That is,
for each x
in the
domain of ƒ,
ƒ (-
x)
= -
ƒ (x).
|
| Therefore,
the
graph of such a function is symmetrical with respect to the
origin, as is the graph shown in the right figure above. |
|
|
|
|
|
|
|
|
|
|
|
| Calculus
contents A |
|
 |
|
| Copyright
© 2004 - 2020, Nabla Ltd. All rights reserved. |