|
|
|
|
Graphing
Linear Equation, Linear Function (First Degree Polynomial)
|
 Linear
function f (x) = mx + c
 |
| Slope-intercept form of a line
|
| Slope
or gradient, y-intercept and x-intercept or zero of a function |
| The graph of
the linear function |
 Properties
of the linear function
|
 Lines
parallel to the axes, horizontal and vertical lines
|
|
|
|
|
|
|
| Linear
function f
(x) = mx + c |
| The expression,
y =
mx
+ c or
y
= a1x + a0,
we call linear function
or slope-intercept form of the
equation of the line. Where, the constant
m is called the
slope or gradient
and the constant c is the
y-intercept. |
| The slope
of a line is the ratio of its vertical change to its horizontal
change, or it is the tangent of the angle between the direction
of the line and the x-axis. |
| The y-intercept is the point of intersection between
the graph of the function and the y-axis. |
| The zero
of a function or the x-intercept
is the value of the
independent variable x
at which the value of the function is zero. |
|
| The graph of
the linear function |
|
|
| this
expression, in a coordinate system, represents the translation
of the source linear function y =
mx
in the direction of the
y-axis
by y0 =
c
or the translation in the direction of the x-axis
by x0 =
-
c/m as is shown
in the figure above. |
| Therefore,
the linear expression we also write as |
| y
= a1x + a0
or y
= a1(x
-
x0)
or y
- y0
= a1x,
where y0
= a0 |
| To find
the zero or the x-intercept
of the linear function set y
= 0 and solve
the equation for x,
i.e., |
|
y
= 0 =>
0
= a1x + a0 |
 |
|
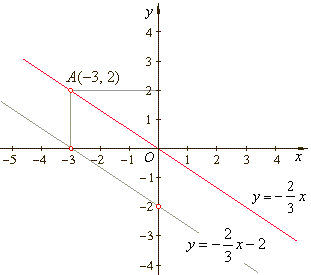
| Example:
Find the equation of the line that passes through the
origin and the point A(-3,
2).
Translate the line in the direction of the x-axis
by x0 =
-
3, then find its equation. |
| Calculate
the slope m by
plugging the coordinates of the point A
into the equation y =
mx, |
| |
|
|
 |
 |
| By
plugging x0 =
-
3 into y
= a1(x
-
x0) |
 |
|
|
| Properties
of the linear function
|
| We examine the behavior of a function
y =
f (x)
by moving from left to right in the direction of x-axis by inspecting its graph. |
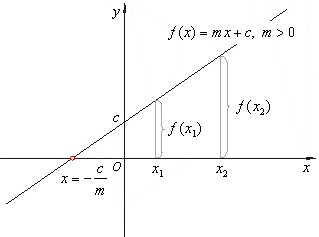
| The linear
function f
(x)
= mx
+ c,
m
> 0 is increasing, the graph rises from left to right, that is, |
|
f(x1)
<
f(x2) for all
x1
< x2 |
 |
|
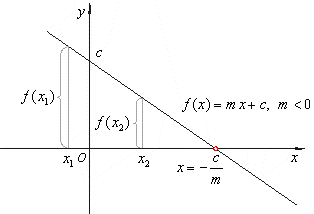
| If
m
< 0 linear function decreasing,
f (x1)
> f (x2) for all
x1
< x2 i.e., the graph falls from left to right. |
 |
|
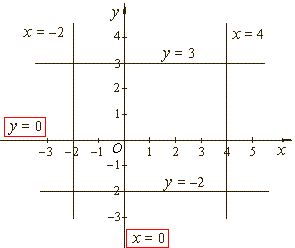
| Lines
parallel to the axes, horizontal and vertical lines
|
| If
m =
0, the function does not depend of
x. To every number
x
associated is the same constant value y =
c.
|
| A
line parallel to the x-axis
is called a horizontal line (or constant). |
| If
the x
value never changes a line is parallel to the y-axis.
A line parallel to the y-axis
is called a vertical line. |
|
 |
|
| The linear function changes the sign at the root or zero point. |
| Thus,
if |
m > 0, |
then |
f
(x)
< 0 |
for all |
 |
while
|
f
(x) > 0 |
for all |
 |
|
|
|
That
is, f (x)
= mx
+ c,
m
> 0 is negative for all x
less than the root,
positive for all x
greater than the root, and at the root f
(x)
= 0. |
| If |
m < 0, |
then |
f
(x)
> 0 |
for all |
 |
while
|
f
(x)
< 0 |
for all |
 |
|
|
|
|
|
|
|
|
|
|
|
|
| Intermediate
algebra contents |
|
 |
|
| Copyright
© 2004 - 2020, Nabla Ltd. All rights reserved. |