|
|
|
|
Applications
of differentiation - the graph of a function and its derivatives |
 Generalization
of the mean value theorem, concavity of the graph of a function
|
 Concavity of the graph of a
function
 |
|
Concave
up and concave down definition |
|
|
|
|
|
|
|
| Generalization
of the mean value theorem concavity of the graph of a curve |
| Let
f
be a function continuous
on a closed interval [a,
b]
with
f '(x)
defined on that interval and
f ''(x)
defined
on
(a,
b),
then |
 |
| By substituting
a
= x
and b
= x
+ h, where
x
is a given value and h
is a variable quantity we get |
 |
| To
prove the formula we introduce new function |
 |
| where
Q
is still undetermined. |
| Since
j
(b)
= 0,
we
can define
Q
by setting j
(a)
= 0
too,
|
 |
| what
gives |
 |
|
|
| Now,
since j
(x)
at both endpoints of the interval is zero and has the derivative |
| j'
(x)
= - (b -
x) f '' (x) + (b -
x) Q |
| then,
by Rolle's theorem, there exists a point c
(a
< c
< b)
such that j'
(c)
= 0,
that is, |
| - (b -
c) f '' (c) + (b -
c) Q
= 0
or Q
= f ''
(c), |
| and
after
equating both values of Q
obtained is the generalized mean value formula to be proved. |
| Thus
for example, to evaluate a function around the origin we
should set x
= 0
and substitute variable h
by x |
| |
into |
 |
so we get |
|

|
|
| Concavity of the graph of a
function |
| Concavity
defines the shape or form of the graph of a function that is describes
whether the graph is concave up
(the cup opens upwards) or concave down (convex). |
|
| Concave
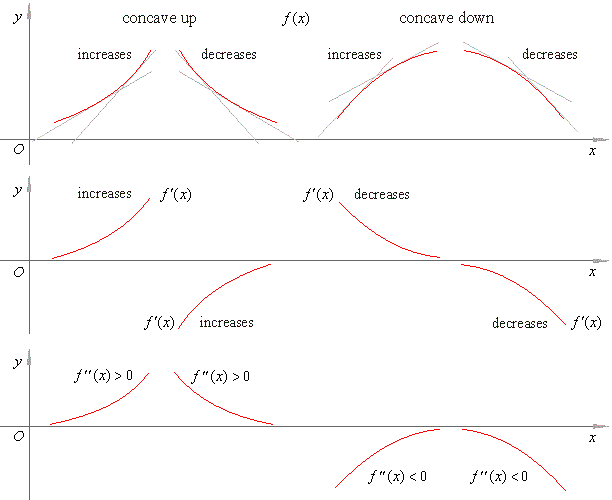
up and concave down definition |
| A
function is said to be concave
up on an interval if
its first derivative is increasing on the interval. |
| At
the same time the second derivative of the function is positive on the
interval. |
| A
function is said to be concave
down on an interval
if its first derivative is decreasing on the interval. |
| At
the same time the second derivative of the function is negative on the
interval. |
| By
following up changes of the slope of the tangent lines drawn to the graph
of a function y = f
(x),
while moving
along
the positive direction of the x-axis,
we get the information whether the derivative of
f is increasing or
decreasing. |
| Let
write the equation of the line tangent to the function at the point P
(x0,
f (x0)) |
 |
| then
the function values around x0 |
 |
| where
the term |
 |
shows
the distance of the curve from the tangent
at the point x0
+ h. |
|
|
|
| A
function is said to be concave up on an interval if the graph of the
function lies above the tangent in the neighborhood
of P. |
| A
function is said to be concave down on an interval if the graph of the
function lies below the tangent in the neighborhood
of P,
as is shown in above figures. |
| Therefore,
the graph of a function to be concave up at a point x
= x0, the difference |
| f
(x0
+ h) -
yt
(x0
+ h)
must be positive, or f
'' (x0 ) >
0. |
| Similarly,
the graph of a function is concave down at a point x
= x0
if f
'' (x0 ) <
0. |
| Since
the second derivative is derived from a given function by
differentiating its first derivative then for example,
the concavity condition f
'' (x) > 0 shows that
the graph of f ' (x)
increases while x
variable passes
through the point x0
moving in
the positive direction of the x-axis. |
| At the same time, changes of the
slope of the tangent line show whether the graph of a function increases or
decreases passing through
the positive or negative values. |
| That is, it depends on whether the
angle between the
tangent line and
the positive direction of the x-axis
is acute or obtuse and whether it increases or
decreases while x
increases. |
| In the figure below shown is how concavity of the graph of a function relates to the graphs of its first and the second derivative. |
 |
|
|
|
|