|
| Transformations
of original or source function |
| How
some changes of a function notation affect the
graph of the function |
| Some
changes
in a function expression
(or an equation/formula)
do not affect the shape or the form of the
graph of the original (or
given function) y
= f (x). |
| Such
changes include use of geometrical transformations like
translations (or shifts) of the graph of the
original function in
the direction of the coordinate axes, or its reflection across
the axes, to graph the function. |
|
| Translations
of the graph of a function
|
| The
graph of
horizontally translated function |
| y
= f (x - x0)
|
| is
obtained translating (shifting) the graph of its
original or source function y
= f (x)
horizontally by
x0
units to the right. |
| The
graph of
vertically translated function |
| y
= f (x) +
y0
or y
- y0
= f (x) |
|
is obtained translating (shifting) the graph of its
original function y
= f (x)
vertically by
y0
units up. |
| The
graph of
horizontally and vertically translated function |
| y
= f (x - x0)
+ y0
or y
- y0
= f (x - x0)
|
| is
obtained translating (shifting) the graph of its
original function y
= f (x)
in both directions of the coordinate axes, horizontally by
x0
units
to the right and vertically
by
y0
units up. |
|
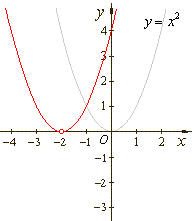
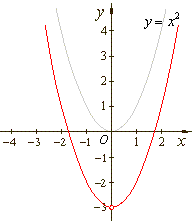
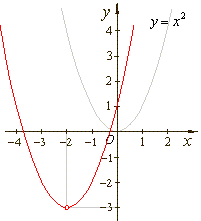
| Example: Draw
the graphs of the given three quadratic polynomials, |
| a)
y
= x2 + 4x + 4 = (x + 2)2,
b)
y
= x2 -
3
and
c)
y
= x2 + 4x + 1
or
y
+ 3 = (x + 2)2 |
| as
the translations of the same source quadratic y
= x2. |
 |
 |
 |
| a)
y
= (x + 2)2 |
b)
y
= x2 -
3
|
c)
y
+ 3 = (x + 2)2 |
|
|
| Reflections
of the graph
of a function |
|
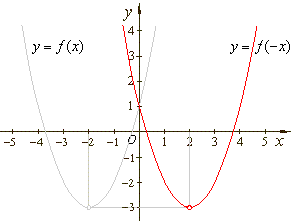
Change of the sign of
the independent variable of a function, denoted as y
= f (-x),
reflects the graph of the given (original) function y
= f (x)
across the y-axis. |
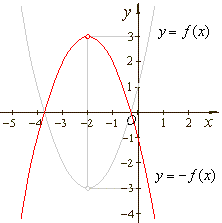
| Change
of the sign of the function, denoted
as y
= -f
(x),
reflects the graph of the given function y
= f (x)
across the x-axis. |
| Changes
of the signs of both, independent variable and the function, denoted as
y
= - f
(- x),
reflect
the graph of the given function y
= f (x), across the y-axis
and the x-axis. |
|
| Example: Given quadratic
polynomial y
= f (x) = x2 + 4x + 1
or
y
+ 3 = (x + 2)2,
transform to: |
|
a) y
= f (- x),
b)
y
= - f
(x)
and c) y
= - f
(- x),
and draw corresponding graphs. |
|
| Solution:
a)
y
= f (- x)
= (- x)2 + 4(- x) + 1
= x2 - 4x + 1
or
y + 3 = (x
-
2)2 |
|
b) y
= - f
(x)
= - (x2 + 4x + 1)
= - x2
-
4x - 1
or
y -
3 = - (x + 2)2 |
|
c) y
= - f
(- x)
= - ((- x)2 + 4(- x) + 1)
= - x2 +
4x - 1
or
y - 3 =
- (x
-
2)2 |
 |
 |
| a)
y
+ 3 = (x - 2)2 |
b)
y
- 3 =
- (x + 2)2 |
|
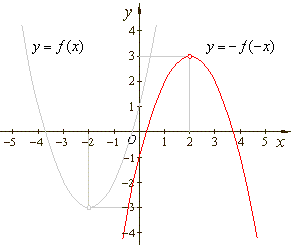 |
| c)
y
= -x2 + 4x
- 1
or
y
- 3 =
- (x
- 2)2 |
|
|
|
|
|