|
| Trigonometry |
|
|
Graphs of
Trigonometric Functions |
|
The
Graph of the Function y = acos
(bx + c) |
 The
graphs of the functions,
y = asin
(bx + c) and
y = acos
(bx + c),
examples
 |
|
|
|
|
|
|
|
|
|
|
Graphs of
trigonometric functions |
| Visual presentation of changes and behavior of each trigonometric function shows us its graph in the
coordinate plane
xOy.
|
| A graph of a function is formed by points
P(x, f (x)), where the abscissas
x
belong to the domain and the calculated values of the function f(x)
as the ordinates, which are the corresponding values from the range.
|
|
|
The
graph of the function y = acos
(bx + c) |
| The parameters
a,
b
and c
have the same influence on the graph of the function cos
x as to the function
sin x, since we already know that the cosine function is translated sine function and vice versa. |
| Thus, for example
the function |
 |
repeats once in the interval |
 |
that is within |
 |
|
| Therefore, the function repeats itself at every interval of the length
4p or the period
P = 4p
and the initial point
of the given interval at x = p/2. |
|
At the same time it means that the graph of the given function can be obtained translating the function
|
 |
 |
|
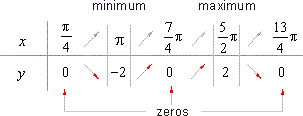
| Example:
Examine the properties, draw the graph and analyze behavior of the function
|
| y
= -
2sin (2x/3 -
p/6).
|
| Solution: Comparing
with y
= a sin (bx + c)
it follows that, a
= -
2, b
= 2/3 and c
= -
p/6. |
| The influences of the given parameters to the shape and the position of the graph in a coordinate system we can examine and analyze on the following
way, |
| - since
a < 0 the graph of the given function, relating to the graph of the source function
y = sin x, is flipped around the x-axis and bounded by lines
y = -
2 and y =
2. |
| -
The least or principal period of the function |
 |
therefore, the function |
|
|
repeats once within the interval 3p. |
| -
Horizontal translation of the graph |
 |
what means that the given period will |
|
|
have its initial point at x0
= p/4
and the ending point at x0
= p/4
+ 3p. |
|
That is, the function will repeat itself once
within the interval x
Î
[p/4,
p/4
+ 3p]. |
| -
Zeros of the function y
= a sin (bx + c)
we calculate from |
 |
| -
The abscissas of extremes ( maximums and minimums) of the given function (or
y
= a sin (bx + c)) we
|
| calculate from
|
 |
|
|
| According to the properties drown is the graph of the given function.
|
 |
| Behavior of the function within the principal period,
|
 |
|
|
 |
|
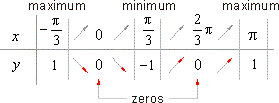
| Example:
Examine the properties, draw the graph and analyze behavior of the function
|
| y
= cos (3x/2 + p/2).
|
| Solution: Comparing
with y
= a cos (bx + c)
it follows that, a
= 1, b
= 3/2 and c
= p/2. |
| The given parameters determine the
properties, |
| - since
a = 1, the graph of the function is bounded between
y = -1 and
y = 1, |
|
|
| - the translation |
 |
|
|
|
thus the given interval x
Î
[-
p/3,
p]. |
| - the zeros of the function
y
= a cos (bx + c)
we calculate using the formula |
 |
| - the abscissas of the extremes of the function
y
= a cos (bx + c)
we calculate using the formula |
 |
 |
| The behavior of the function within the principal period,
|
 |
|
|
 |
|
|
|
|
|
|
|
|
|
|
|
|
|
|
|
|
|
| Functions
contents D |
|
|
 |
|
| Copyright
© 2004 - 2020, Nabla Ltd. All rights reserved. |